The disciplines of planning and risk management are closely linked. They provide the project manager with a blueprint of what should and shouldn’t happen. Since they are intrinsically linked, it’s worth looking at the disciplines working more closely together.
This article covers, in three stages, key interfaces between the planning and risk management disciplines.
- Risk friendly schedules – guidance on the risk approach to planning.
- Smarter planning with risk analysis – explains how risk analysis gives vital information on improving the plan.
- Using schedule reserve – a brief overview of techniques planners can use to set aggressive targets, but also maintain confidence of delivering on time.
Each section gives tips on techniques to apply and uses the Tyne & Wear Metro case study to illustrate key points.
Tyne & Wear Metro case study
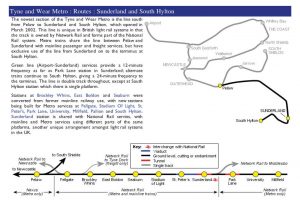
Figure 1. The Tyne & Wear Metro Note: Some examples used in this case study come directly from experience with the Tyne & Wear Metro project, others are interpreted from other projects Risk Decisions has worked on. All names and references to details have been changed to ensure anonymity.
The Tyne & Wear Metro extension / upgrade project (opening up an old line closed during Dr Beeching’s days in the 1960’s) will be used as our case study. This project involved new build, refurbishment and the link between them, and involved the management of some significant risks. Taking possession of a busy, operational commuter railway, with the requirement to keep existing services running, working around normal opening hours and minimising weekend closures, was a significant challenge. In addition, there was a requirement to design for the future, not just the present, to consider future increases in passenger numbers, potential new safety regulations and any ongoing government initiatives.
1. Risk Friendly Schedules
At the earliest stages of a project, planning takes a set of initial requirements and starts to shape them into a workable form: structuring work packages, agreeing what’s in scope and what’s not in scope and starting to capture top level risks that may arise. From the beginning, the planning approach taken will determine how easy it to for other disciplines to be effective. From a risk perspective, it important to develop a structure suitable for identifying and managing risks in a meaningful way and at the right level.
Project Structure
The various different ways to structure the Metro Extension project were considered and a product based Work Breakdown Structure (WBS) was decided on. This focussed on deliverables, providing something concrete to identify risks against. Each deliverable was set up as a Control Account against which a time based budget (project and risk) was set and monitored. As shown below, the WBS for Phase 3A of the Metro project was split into logical sections of Line (not necessarily of equal length) and Stations. Any additional large items on each Line, such as tunnels and bridges were treated as separate units.
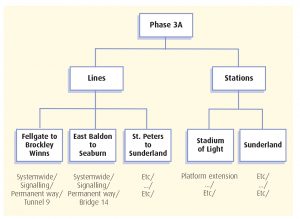
Figure 2. Product based Work Breakdown Structure
Project Plan Layering and Balancing
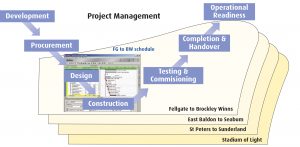
Figure 3. Layering Control Accounts and placing the process elements on top
The next thing considered when structuring the project plan was the level at which risk analysis information was required. Since budgets were allocated and monitored at control account level, it was agreed that both cost and schedule risk analysis should be performed at this same level. We scheduled the control accounts in Primavera, adding traditional ‘V’ shaped systems engineering process tasks, plus project management tasks into each. Risk analysis was then performed on each of the key control accounts.
Note: we did not risk analyse every control account, but instead prioritised those control accounts that were thought to involve most uncertainty. The individual risk analysis results were used to provide input to a top down view of the schedule (approximately 120 tasks) created in MS Project. Again this was analysed and the results were saved back into MS Project to display the uncertainty (10, 50, 90% confidence finish date for each task) on the Gantt chart.

Figure 4. Risk analysis results for a Control Accounts in Predict! Risk Analyser
Initially, the top down schedule was only used to reconcile the top down systems engineering view of the project, identifying the ‘pinch points’ of the plan. However, when we presented the findings to the executive board, this top down view became a regular format for reporting to senior management. Another result of the risk analysis produced a Tornado chart to pinpoint the highest risk areas of the schedule. However, the first set of results only highlighted the process elements of the plan, because they were considerably longer than the product based deliverable items.
So the process tasks had to be stripped out and other lengthy tasks split into several smaller tasks; the schedule was risk analysed again to produce far more useful and balanced Tornado result.
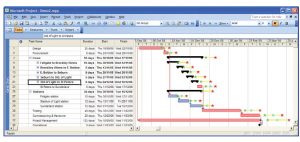
Figure 5. Top down view of the project, showing uncertainty results
Understanding Merge Bias
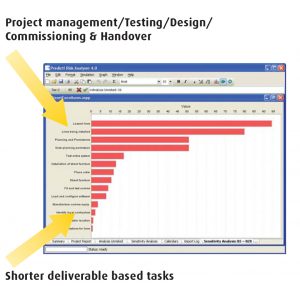
Shorter deliverable based tasks Figure 6. Tornado chart in Predict! showing ‘unbalanced’ items as most risky
The final step in creating a risk friendly schedule was to consider the level of uncertainty introduced (inadvertently) into the schedule. The plan was examined for parallel tasks which inherently add uncertainty. For example, consider two parallel 10 week tasks, each with a 50% chance of completing on time. The chance of both completing on time is one in four – because there are 3 out of 4 ways in which one or other or both run late. Therefore, you only have a 25% confidence of hitting a milestone following on from these two tasks. The odds were considered for three similar tasks in our schedule, each being performed by different contractors. This task structure had been used to give a good chance of hitting a contract milestone on time, but when the resulting uncertainty was analysed, it was decided to add a schedule buffer to cover the risk of overrun (see further developments on Schedule Reserve below).
However, having applied this uncertainty and risk to the schedule the results were not valid, because the schedule needed tidying up, to make sure it:
- Had sensible (or preferably no) constraints
- Had no danglers (everything must have a predecessor & successor)
- Made visible lags and leads
- Carefully applied SS & FF logic, avoiding where possible, in particular stretch logic (also known as ladder logic)
Of course, this was just good planning practice, so afterwards we had the additional benefit of a tidier plan.

2. Smarter Planning With Risk Analysis
Having structured the schedule with risk in mind, it was time to use schedule risk analysis to provide the planners with more information about the schedule, pointing to areas in which improvements might be made.
Understanding Uncertainty and Risk
Everyone in the team understood the difference between uncertainty and risk: • Uncertainty is derived from estimating error – the inability to predict precisely what something will cost or how long it is going to take. • Risk is a discrete event, with a probability of occurring and an impact (either a positive opportunity or negative threat) if it occurs. Various workshops were run to develop 3-point estimates describing task uncertainty and associated probability/impact risks.
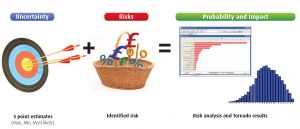
Figure 8. Risk and uncertainty must both be considered (Note: if you want your tasks or risks to appear on the Tornado chart, they must be described using 3 point estimates)
Constraints
Constraints can often have the effect of anchoring parts of your schedule to a specific date, not allowing the true effect of risk and uncertainty to be seen on milestones. A good way to assess the impact of constraints in your schedule is to temporarily switch them of when performing analysis, and see the consequent impact that this has on the variability of the end dates.
Danglers
Tasks that aren’t properly logic linked with a path to the start and the end of the project can be dangerous, because you will never know if they have the potential to appear on the critical path.
Visible Lags and Leads
By making lags and leads visible as separate tasks, it is possible to analyse the uncertainty around any assumptions around them, and to model the impact of risks that may increase a lag or lead.
Stretch Logic
It is worth exploring a stretch logic in particular, and the way in which it can give a false idea that there is float in the schedule. The example below shows two tasks – one for building a set of three window frames, and one task for glazing them. However, since glazing can’t begin until the first frame is completed (2 days in), and the glazing of the last window can’t happen until the last frame is completed, the use of SS and FF logic with lags has been put in place:
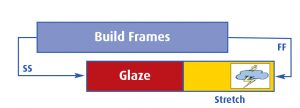
Figure
This allows the Glaze task to stretch, and offers the false impression that the materialisation of any risk would be absorbed by this stretch. This is unrealistic, particularly in a situation where the risk occurs while glazing the last window.
Using the strict finish-to-start logic below allows such a risk scenario to be more accurately modelled: This could create many extra tasks if the schedule needed to show 100 windows. In this case, it may be more appropriate to model the 100 windows separately from the rest of the schedule, and feed the results into the top-down schedule. Alternatively, you could allow the stretch logic to be applied to the first 99 windows, and the separate out the last window using finish-to-start-logic.
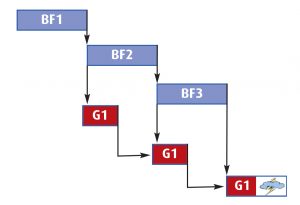
Figure 10. A more realistic alternative to using stretch logic
Risk Analysis and Left Shift
Having tidied up the schedule the reality of our situation could be seen. What’s our chance of success? The picture below reflects the contribution of uncertainty and risk to the schedule.
Establishing:
- Latest and earliest finish dates
- A target finish date and likelihood of achieving it
- Schedule reserve, for overruns
- A measure of inherent schedule exposure
- The chance of liquidated damages
Unfortunately, the customer’s expectation of finish date was far more optimistic than our schedule indicated. It was clear we had very little confidence of delivering to the required timescales with the current plan. Ways of achieving an earlier finish date had to be identified. By addressing the logic, uncertainties and most importantly, the amount of mitigation we were prepared to undertake to minimise the risks, we were able to achieve a left shift of the project end date, to meet customer expectations.
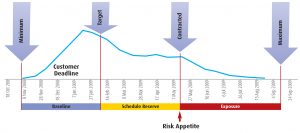
Figure 11. Risk Analysis Results
One of the most important factors was being able to demonstrate to the customer that we had confidence in delivering on time. Finally, the executive board needed to approve the amount of management reserve we would hold and ensure they understood the level of risk exposure that remained. This was agreed on the basis of risk appetite.
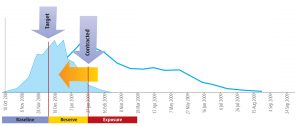
Figure 12. Left shift through risk mitigation
3. Using Schedule Reserve
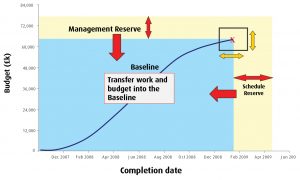
Figure 13. Drawing down Management and Schedule Reserve
The team now looked at how to manage risk and uncertainty through project execution. A key success factor was to ensure effective use of Schedule Reserve.
What is Schedule Reserve?
Most of the project team were familiar with the concept of Management Reserve budget available for draw-down should risks occur. They were less familiar with how they might set up and apply Schedule Reserve. A time-based budget was used to present the timeline, with added Schedule Reserve calculated from risk analysis results above. Care was taken to ensure the project board understood how aggressive the schedule had been set, to help explain any variance as the project progressed.
Tombstone Risks
Two significant project risks were identified during this stage: • A tunnel, blocked up for many years with no certainty of its condition. • A bridge, possibly needing reinforcement if structural defects were found. These risks had very small probability, but huge impact if they did occur. Simple ‘expected’ schedule delay would not cover their occurrence. It was agreed with the customer that these risks should be excluded from the main contract.
Schedule Buffers
Finally, the planners worked out the likely requirement for draw down of Schedule Reserve during the project, to avoid penalties against milestone promise dates. The working project schedule was set using aggressive target dates, but the contract dates included schedule buffers.
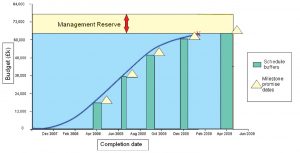
Figure 14. Using schedule buffers to set milestone promise dates


